
Project 3.5.3 » Figure12
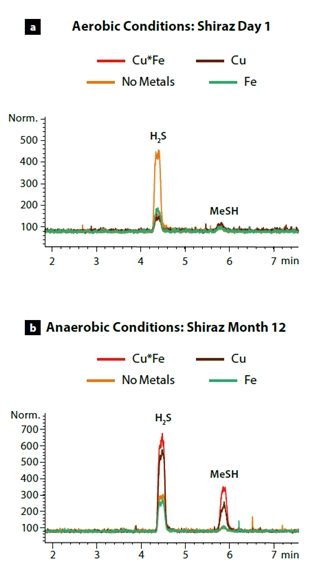
Figure 2. Typical chromatograms for the analysis of H2S and MeSH in Shiraz wine samples with added Cu, Fe and the metal combination Cu*Fe shown at (a) Day 1 and at (b) Month 12.

Figure 2. Typical chromatograms for the analysis of H2S and MeSH in Shiraz wine samples with added Cu, Fe and the metal combination Cu*Fe shown at (a) Day 1 and at (b) Month 12.