| Test | Paired preference | ||||||||||||||||||||
| Min. Tasters1 | 7 | ||||||||||||||||||||
| Use | Which wine is preferred | ||||||||||||||||||||
| Samples | Two coded test samples (A,B) | ||||||||||||||||||||
| Tasting sheets | Click here | ||||||||||||||||||||
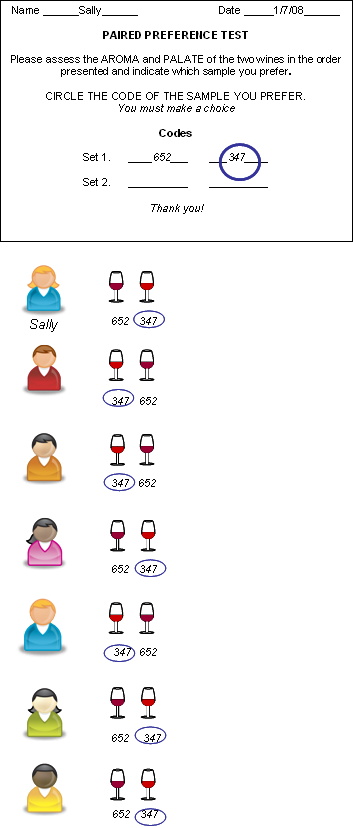
| Basic method | Tasters assess both samples and indicate which one they prefer. A choice must be made; the taster cant say they prefer neither.
Possible serving orders3: AB, BA |
||||||||||||||||||||
Example:
 Count the number of people who prefer 347 over 652 Significance – Required no. preferred 347/total Results:
|
|||||||||||||||||||||
Results Are the wines significantly different?
|
|||||||||||||||||||||
| Notes: 1 Indicates the minimum number of tasters required for testing to achieve a statistically significant result (p < 0.05). 2 Figures denote minimum number of correct responses required out of the total number of responses to conclude the wines are significantly different from each other. 3 Serving orders denote possible arrangements of the samples to be presented randomly to tasters. 4 Figures denote minimum number of tasters who agree on preference for one wine required out of the total number of responses to conclude one wine is significantly preferred over the other. |
|||||||||||||||||||||

