
Project 3.1.3 » fig1
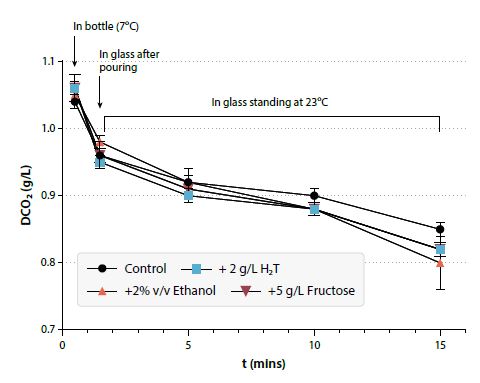
Figure 1. The effect of differences in the white wine matrix on the reduction of dissolved CO2 in the wine glass over the time from pouring to consumption

Figure 1. The effect of differences in the white wine matrix on the reduction of dissolved CO2 in the wine glass over the time from pouring to consumption