

Technical Review – Technical Notes » PMT-formation-technote-fig2oct2022
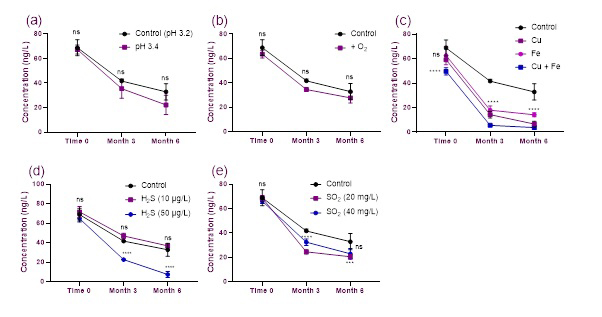
Figure 2. Evaluating factors that influence PMT preservation in model wine. Error bars indicate standard deviation for n =3 samples. Significant interactions are indicated as follows: not significant (ns) for p value > 0.05; * p value ≤ 0.05; ** p value ≤ 0.01; *** p value ≤ 0.001; **** p value ≤ 0.0001.