

Project 4.3.1A » fig25
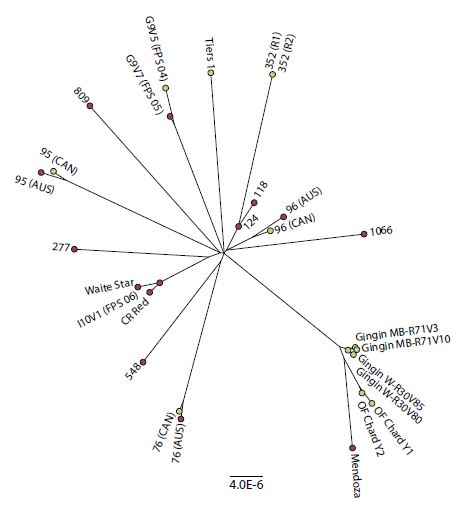
Figure 1. Unrooted phylogeny of Chardonnay clones. Purple nodes represent samples that were used in the original marker discovery analysis in Roach et al. (2018). Green nodes represent new samples that were included for this study. Clone names are indicated in black. Phylogeny is scaled by substitutions per site.